Importing Spreadsheets or CSV files (QGIS3)
Many times the GIS data comes in a table or an Excel spreadsheet. Also, if you have a list lat/long coordinates, you can easily import this data in your GIS project.
Overview of the task
We will be importing a text file of earthquake data to QGIS.
Get the data
NOAA’s National Geophysical Data Center produces a great dataset of all significant earthquakes since 2150 BC. Learn more.
Download Significant Earthquake Database text file.
For convenience, you may directly download a copy of both the datasets from the links below:
signif.txt
Data Source [NGDC]
Procedure
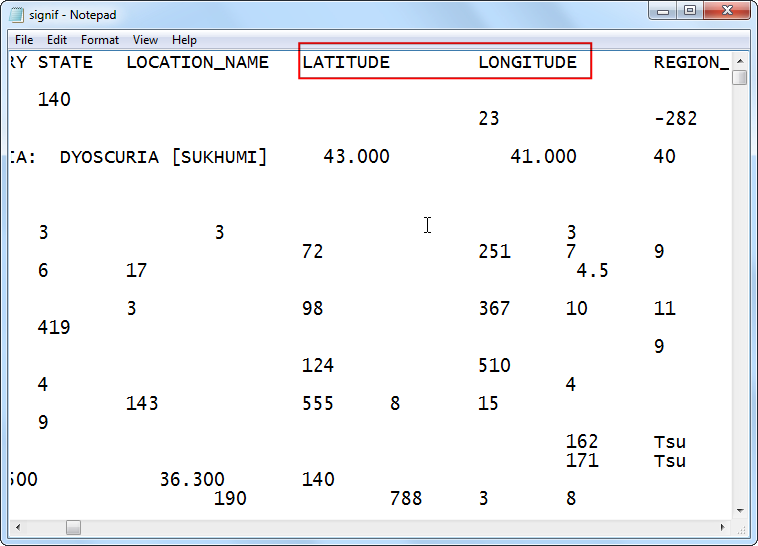
- Examine your tabular data source. To import this data to QGIS, you will have to save it as a text file and need at least 2 columns which contain the X and Y coordinates. If you have a spreadsheet, use Save As function in your program to save it as a Tab Delimited File or a Comma Separated Values (CSV) file. Once you have the data exported this way, you can open it in a text editor such as Notepad to view the contents. In case of the Significant Earthquake Database, the data already comes as a text file which contains latitude and longitude of the earthquake centers along with other related attributes. You will see that each field is separated by a TAB.
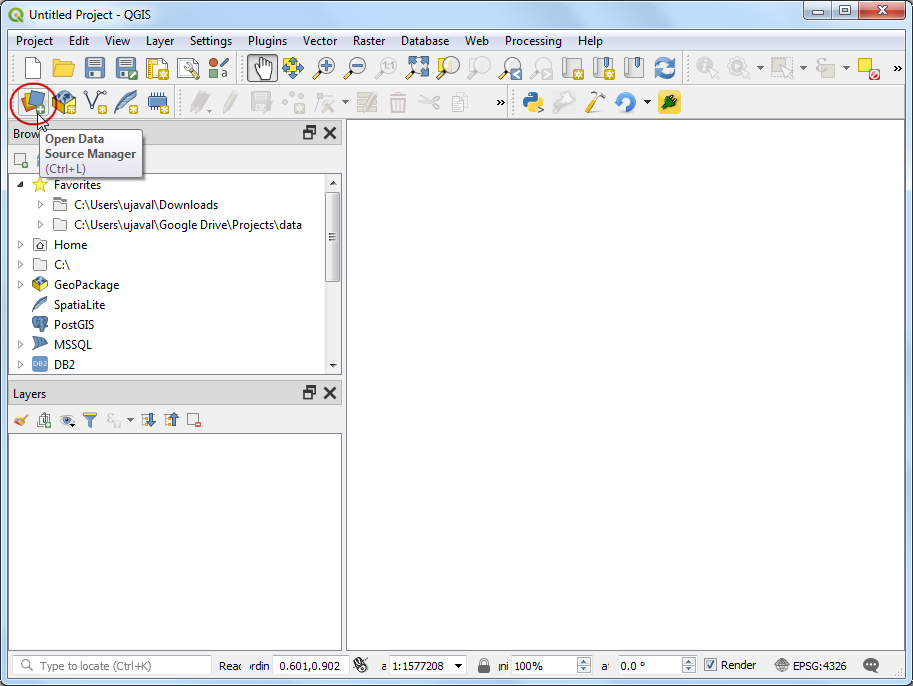
- QGIS3 comes with a unified data manager that allows you to load all the various supported data format. Click the Open Data Source Manager button on the Data Source Toolbar. You can also use
Ctrl + L keyboard shortcut.
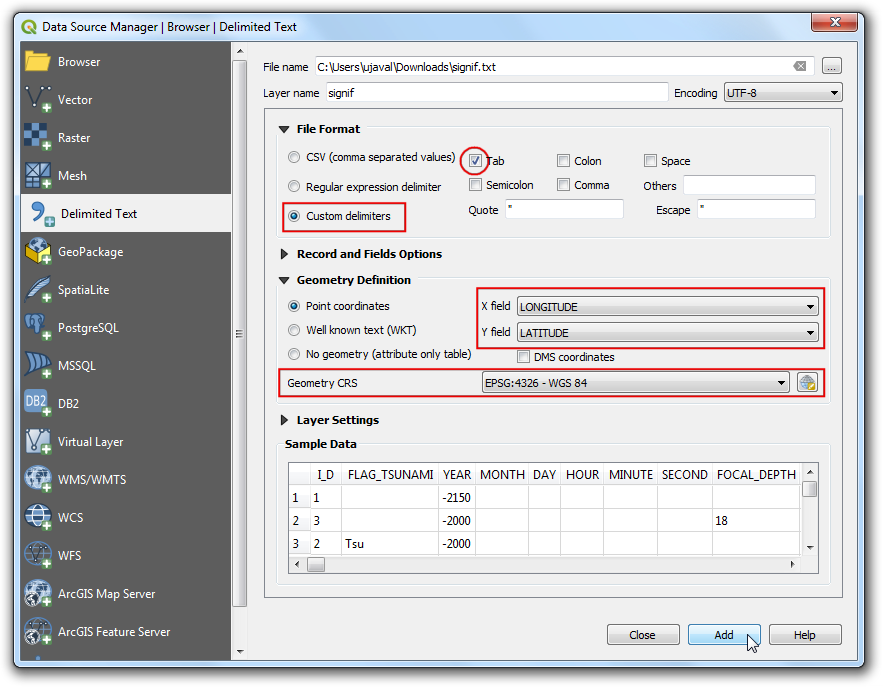
- Switch to the Delimited Text tab. Click the ... button next to File name and specify the path to the text file you downloaded. In the File format section, select Custom delimiters and check Tab. The Geometry definition secction will be auto-populated if it finds a suitable X and Y coordinate fields. In our case they are
LONGITUDE and LATITUDE. You may change it if the import selects the wrong fields. You can leave the Geometry CRS to the default EPSG:4326 WGS84 CRS. If your file contained coordinates in a different CRS, you can select the appropriate CRS here. Click OK.
Note
It is easy to confuse X and Y coordinates. Latitude specifies the north-south position of a point and hence it is a Y coordinate. Similarly Longitude specifies the east-west position of a point and it is a X coordinate.
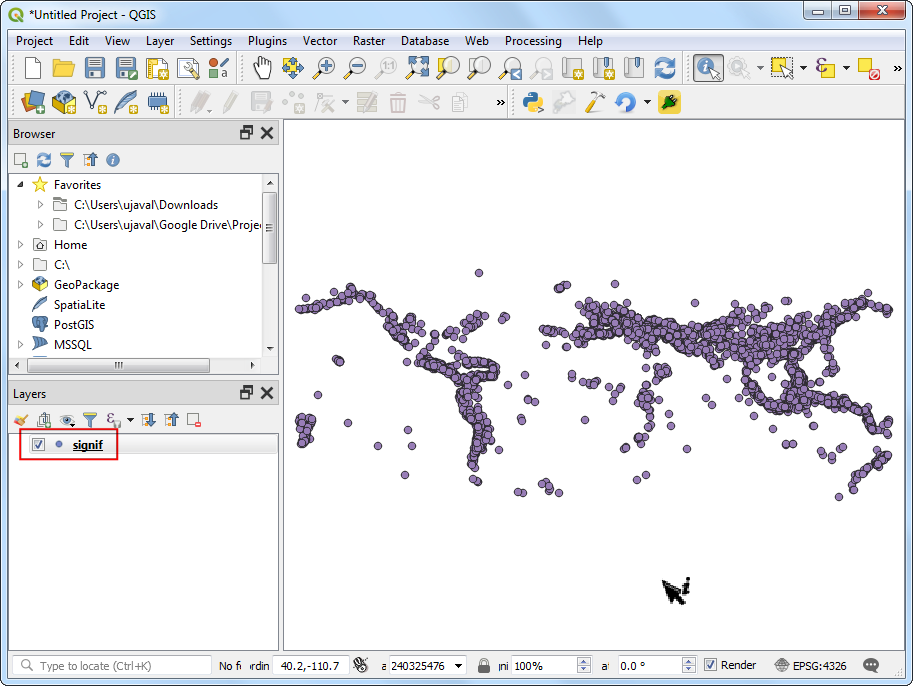
- You will now see that the data will be imported and displayed in the QGIS canvas as a new layer called
signif.