Nearest Neighbor Analysis (QGIS3)
GIS is very useful in analyzing spatial relationship between features. One such analysis is finding out which features are closest to a given feature. There are multiple ways to do this analysis in QGIS. In this tutorial,wWe will explore the Distance to nearest hub and Distance matrix tools to carry out the nearest neighbor analysis.
Overview of the task
Given the locations of all known significant earthquakes, find out the nearest populated place for each location where the earthquake happened.
Other skills you will learn
- Use the Geometry Generator renderer to dynamically create lines from a multipoint layer.
Procedure
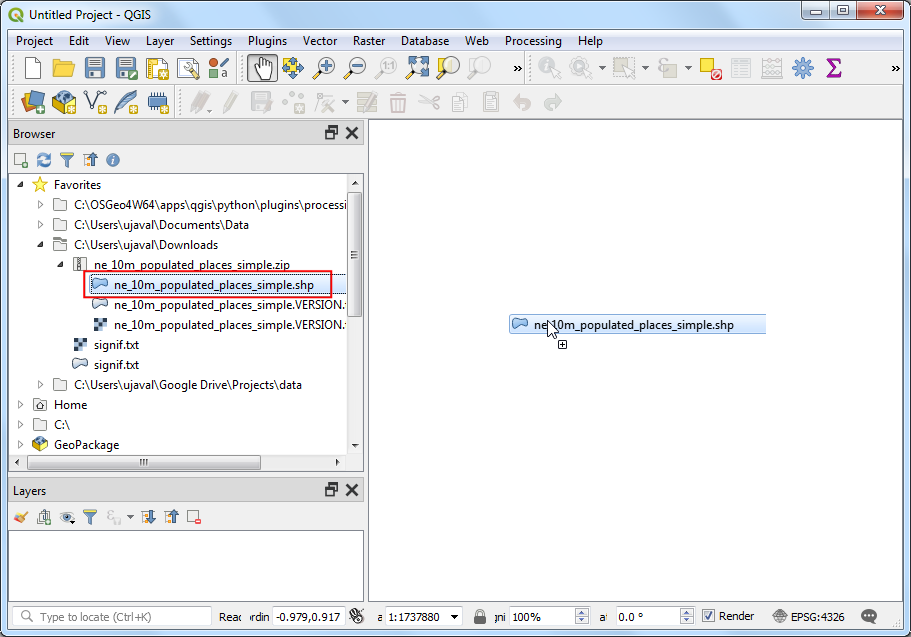
- Locate the downloaded
ne_10m_populated_places_simple.zip file in the Browser panel and expand it. Drag the ne_10m_populated_places_simple.shp file to the canvas.
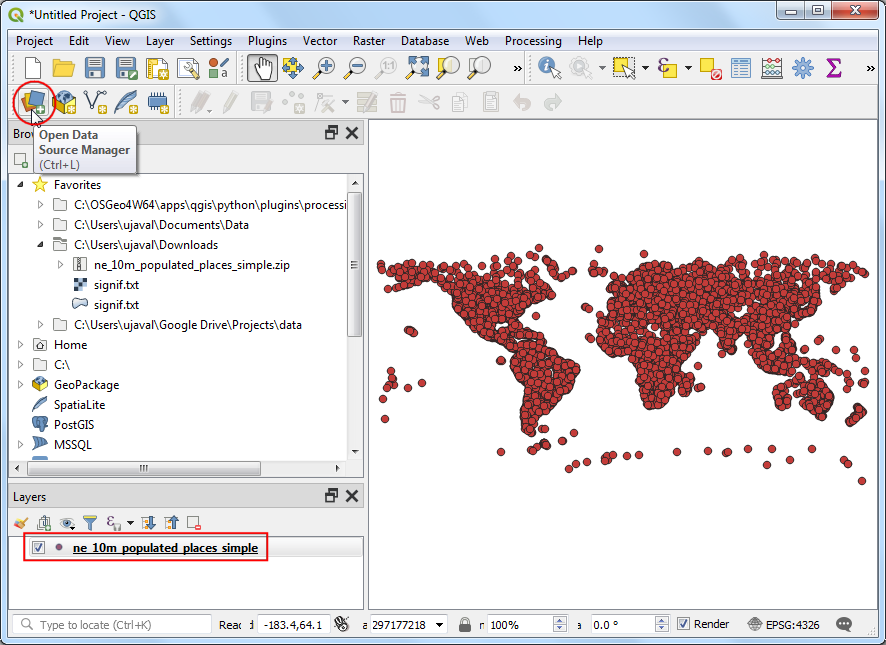
- You will see a new layer
ne_10m_populated_places_simple loaded in the Layers panel. This layer contains the points representing populated places. Now we will load the earthquakes layer. This layer comes as a Tab Serepated Values (TSV) text file. To load this file, click the Open Data Source Manager button on the Data Source Toolbar. You can also use Ctrl + L keyboard shortcut.
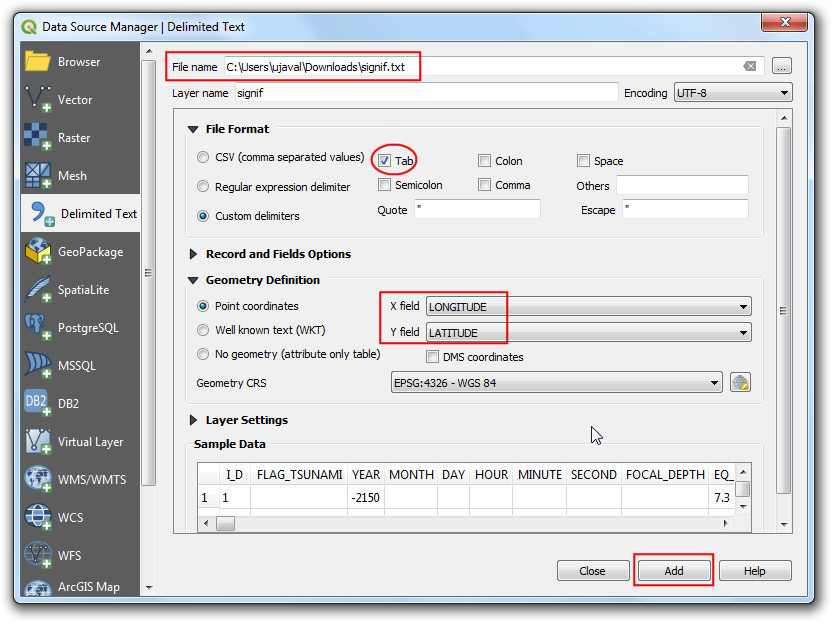
- Click the ... button next to File name and browse to the downloaded
signif.txt file. Once loaded, the File Format and Geometry Definition fields should be auto-populated with correct values. Click Add followed by Close.
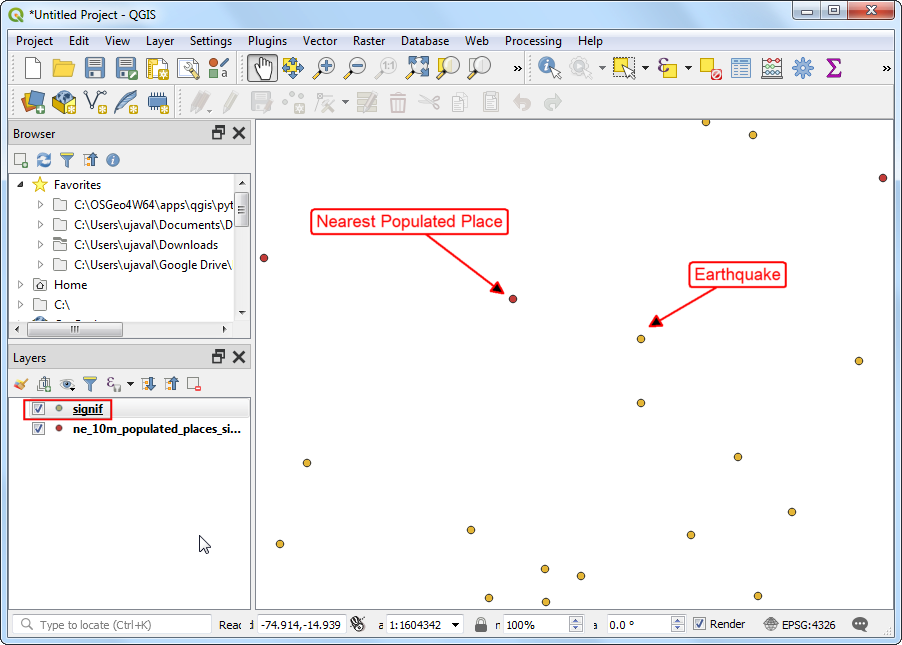
- Zoom around and explore both the datasets. Each yellow point represents the location of a significant earthquake and each red point represents the location of a populated place. Our goal is to find out the nearest point from the populated places layer for each of the points in the earthquake layer.
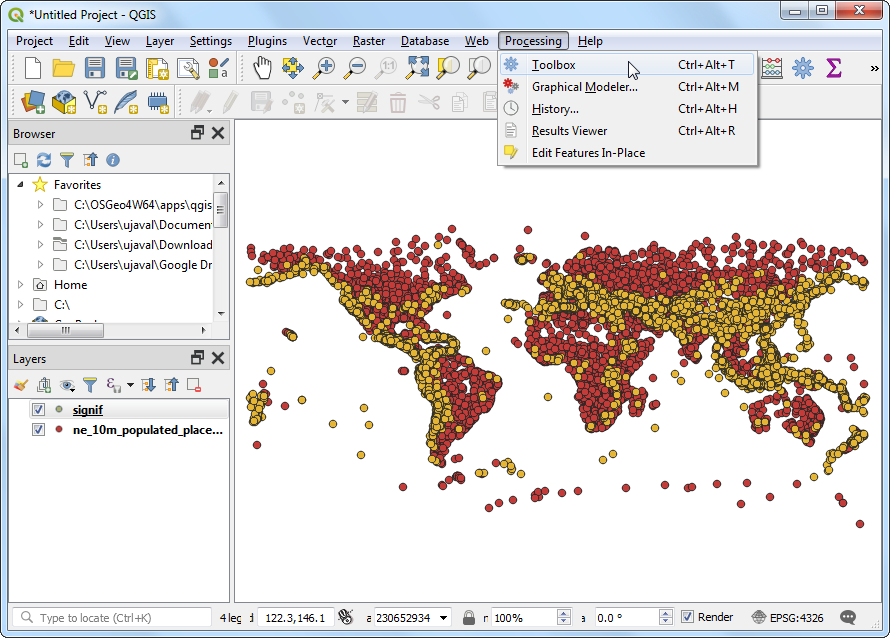
- Before we do the analysis, we need to clean up our inputs. The
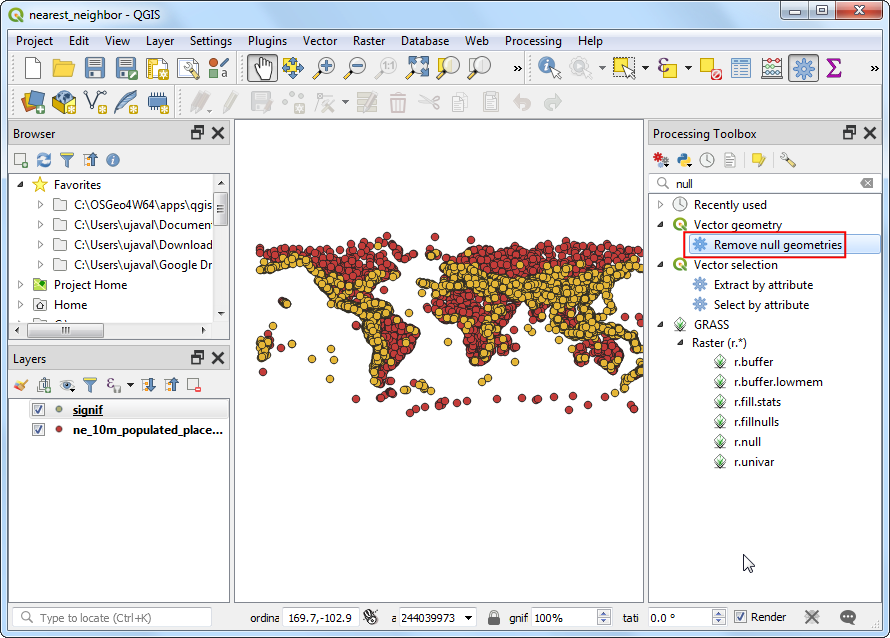
signif layer contains many records without a valid geometry. These records were imported with a NULL geometry. So let’s remove these records first. Go to .
- Search for and locate the tool. Double-click to launch it.
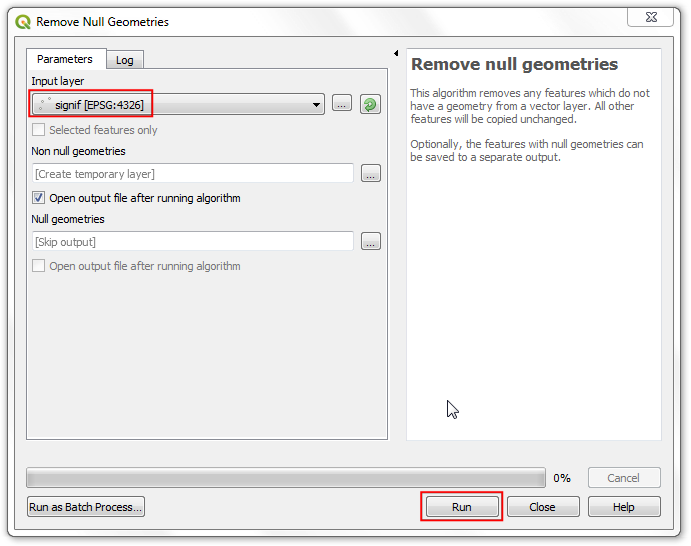
- Select
signif as the Input layer and click Run. Once the processing finishes, click Close.
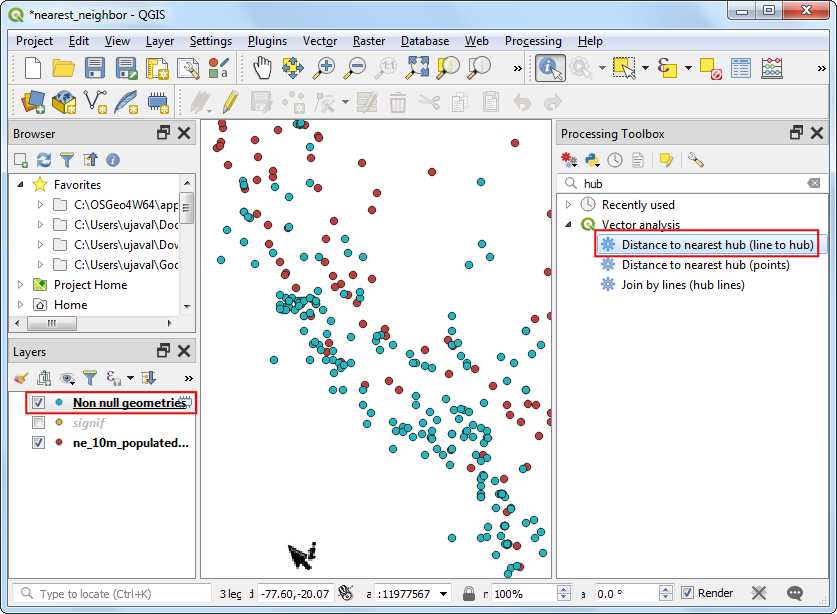
- You will see a new layer caled
Non null geometries loaded into the Layers panel. We will use this layer instead of the original signif layer in further analysis. Un-check the signif layer in the Layers panel to hide it. Now it is time to perform the nearest neighbor analysis. Search and locate the tool. Double-click to launch it.
Note
If you need point layer as output, use the Distance to nearest hub (points) tool instead.
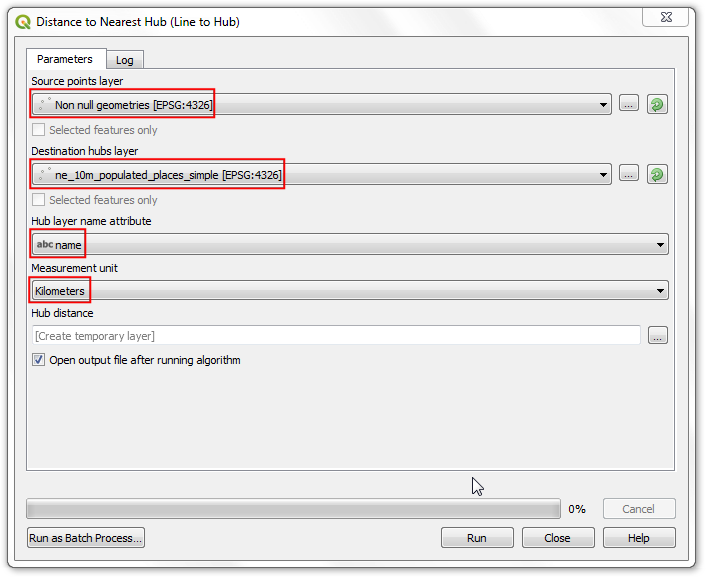
- In the Distance to Nearest Hub (Line to Hub) dialog, select
Non null geometries as the Source points layer. Select ne_10m_populated_places_simple as the Distination hubs layer. Select name as the Hub layer name attribute. The tool will also compute straight-line distance between the populated place and the nearest earthquake. Set Kilometers as the Measurement unit. Click Run. Once the processing finishes, click Close.
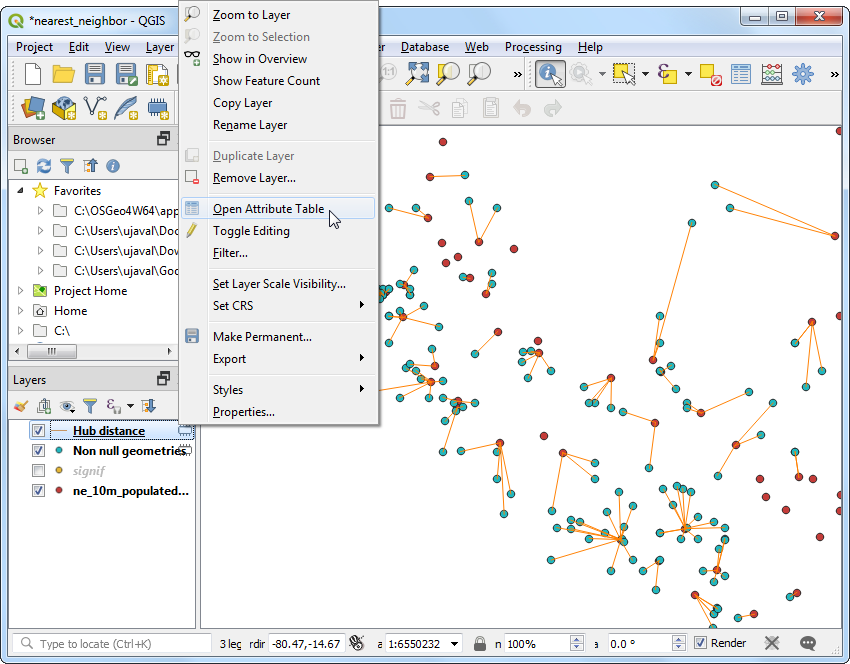
- Back in the main QGIS window, you will see a new line layer called
Hub distance loaded in the Layers panel. This layer has line features connecting each earthquake point to the nearest populated place. Right-click the Hub distance layer and select Open Attribute Table.
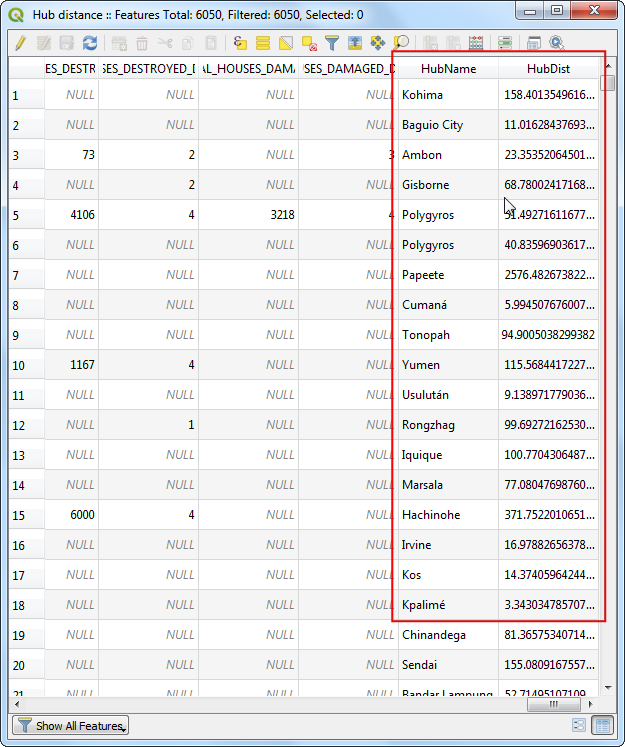
- Scroll right to the last columns and you will see 2 new attributes called HubName and HubDist added to the original earthquake features. This is the name the distance to the nearest neighbor from the populated places layer.
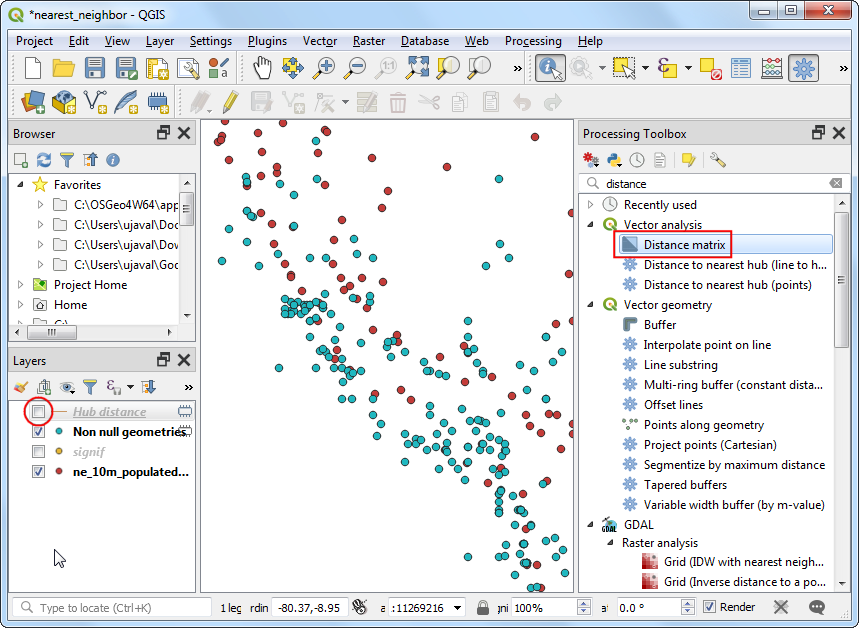
- Our analysis is complete. We can now explore another tool that can also do a similar analysis. Distance Matrix is a powerful tool that allows you to not only compute distance to the nearest point, but to all the points from another layer. We can use this method as an alternative to the Distance to nearest hub tool. Un-check the
Hub distance layer to hide it. Search and locate the tool.
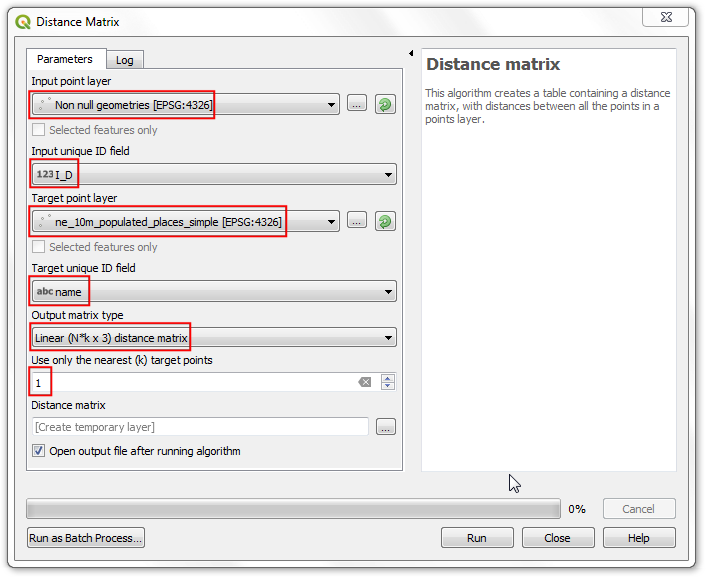
- In the Distance matrix dialog, set
Non null geometries as the Input point laeyer and I_D as the Input unique ID field. Set ne_10m_populated_places_simple as the Target point layer and name as the Target unique ID field. Select Linear (N*k x 3) distance matrix as the Output matrix type. The key here is to set the Use only the nearest (k) target points parameter to 1 - which will give you only the nearest neighbor in the output. Click Run to start the matrix calculation. Once the processing finishes, click Close.
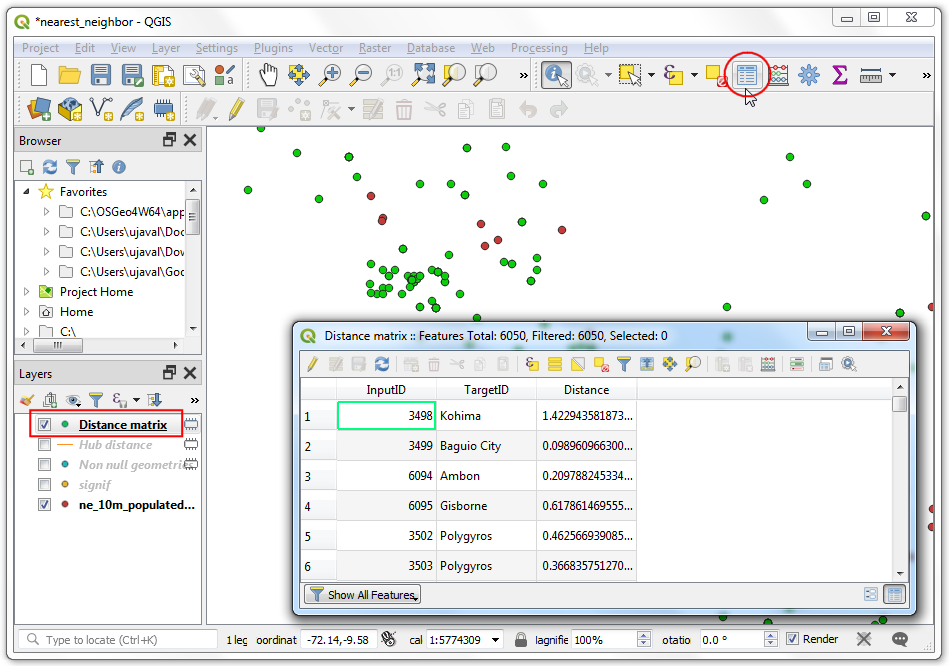
- Once the processing finishes, a new layer called
Distance matrix will be loaded. Note that the output of this tool is a layer containin MultiPoint geometries. Each feature contains 2 points - source and target. Open the Attribute Table for the layer. You will see that each feature has attributes mapping the earthquake to its nearest populated place. Note that the distance here is in the layer’s CRS units (degrees).
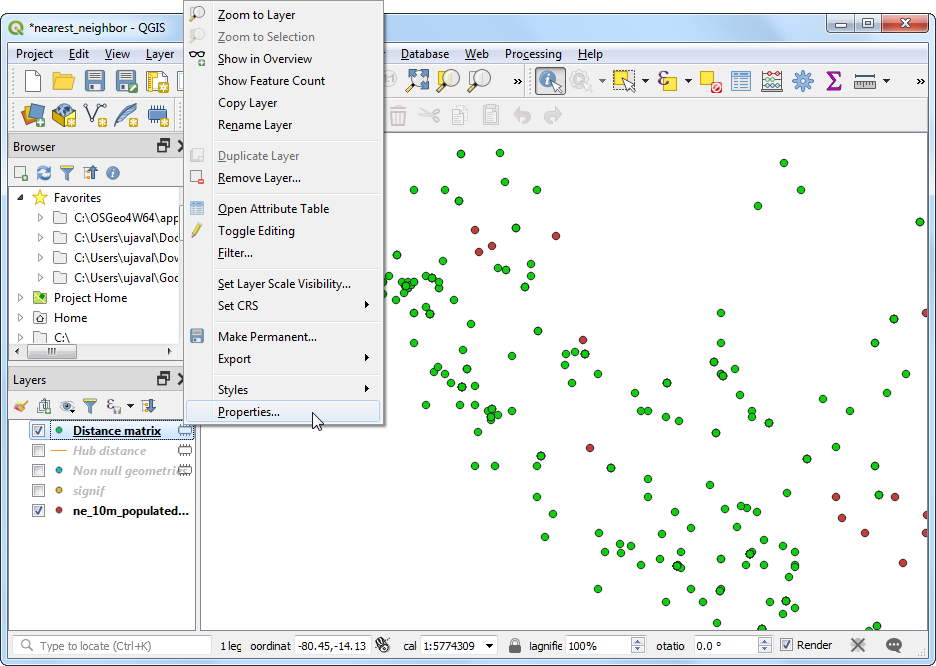
- At this point, you can save your results in the format of your choice by right-clicking the layer and selecting . If you want to visualize the results better, we can easily create a hub-spoke rendering from the feature’s geometry. Right-click the
Distance matrix layer and select Properties.
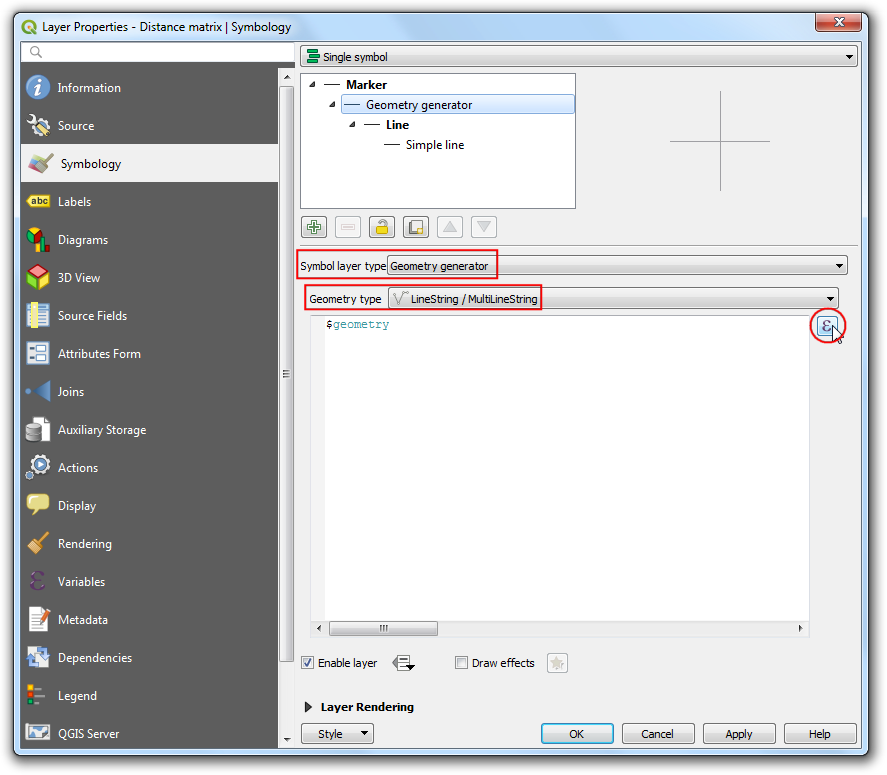
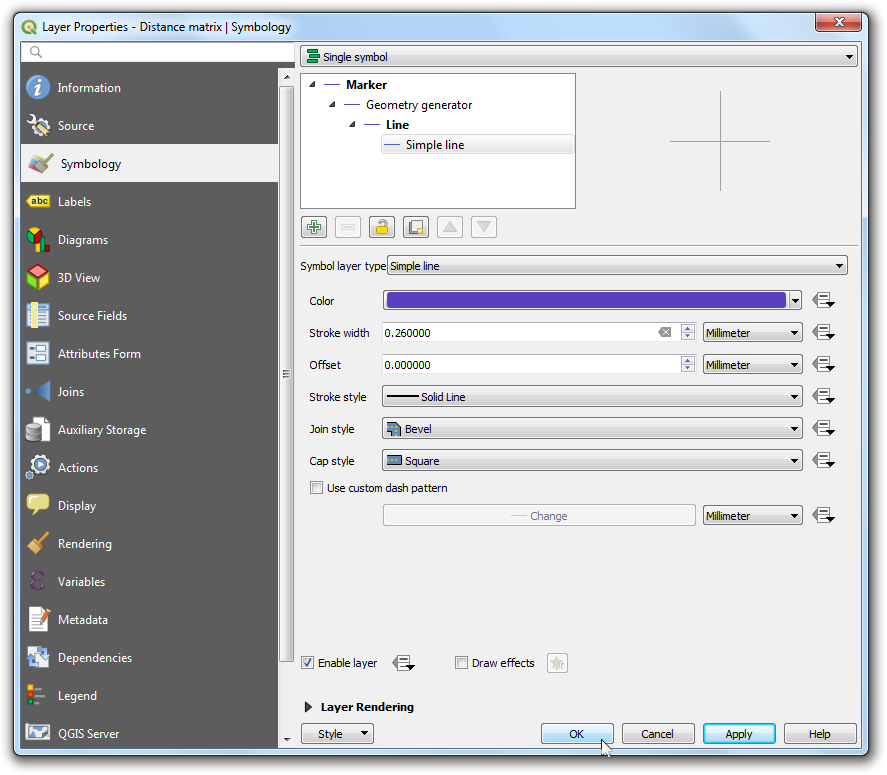
- In the Properties dialog, switch to the Symbology tab. Click on the
Simple marker sub-renderer and select Geometry generator as the Symbol layer type. Set LineString / MultiLineString as the Geometry type. Click the Expression button.
- Here we can enter an expression to create a line geometry from the 2 points within each multi-point source geometry. Enter the following expression.
make_line(point_n( $geometry, 1), point_n( $geometry, 2))

- Back in the Symbology tab, set the style of the line as per your liking and click OK.
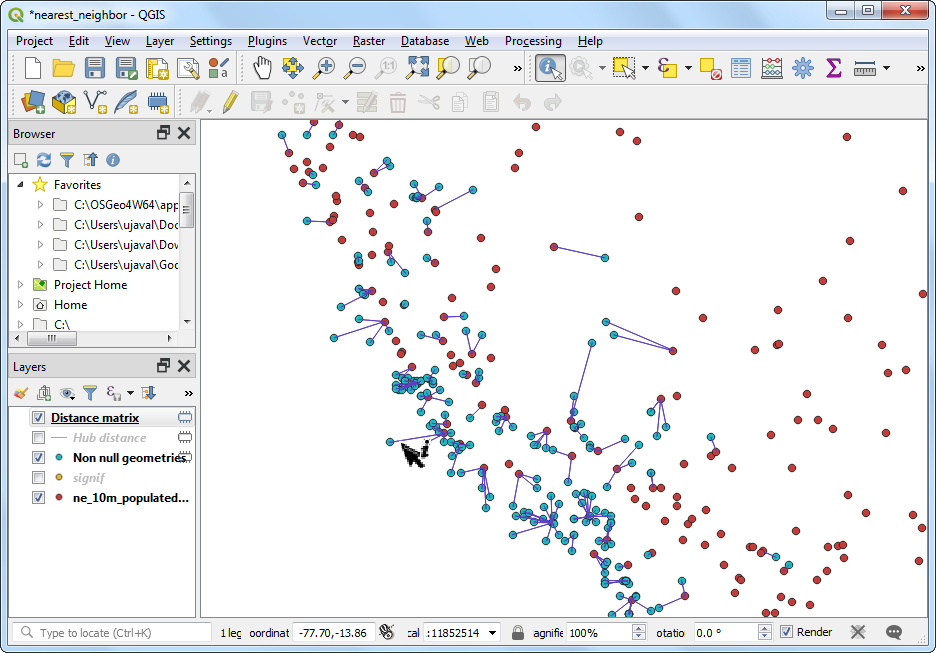
- You will see the
Distance matrix layer now rendered with lines instead of points. Note that we did not have to create a new layer for this visualization. The layer still contains MultiPoint geometries, but it is dynamically rendered as lines based on the expression.